Normalization Is Normal: Reflecting Reality in Big Data Sets
As the data sources we use to inform strategic decisions grow in size and complexity, it can be challenging to keep up with the nuances of data quality and reliability.
No matter the application or the buzz that surrounds it, using big data comes down to one foundational question:
How can you be confident that the insights you’re seeing accurately represent what’s happening in the real world?
Big data sets — like the geolocation data set Zartico sources — are raw materials that require precise processing in order to produce usable insights. This processing eliminates errors and anomalies and corrects biases, and it’s a fundamental and expected part of working with data.
Normalization is one of these processes. Normalization applies mathematical techniques to enhance the representativity of the data — in other words, it makes your data look more like the real world.
Big data needs normalization — here’s why.
When early statisticians developed many of the statistical processes we are most familiar with, they primarily used laboratory data sets — collected with painstaking precision, relatively controlled, consistent, and easy to work with. But in the world of “big data,” collecting as many data points as possible requires more relaxed collection standards.
Real-world data is an incredible source of valuable insights, but less control means more messiness. If we want to continue to derive meaningful information from these data sets, then our data science techniques must evolve accordingly.
Geolocation data sets are massive. The data source that Zartico uses — the largest available on the commercial market — includes more than 2 billion daily location observations.
At the most basic level, geolocation data is a set of latitude and longitude coordinates linked to an anonymized device ID and a timestamp. These data points are collected through smartphone apps that users opt into. Geolocation data providers then aggregate observations from hundreds of thousands of apps to create a robust data stream.
This robust stream, however, is messy. Here’s one way to think of it:
If you were to use the raw data to draw a picture of what’s happening within your destination, it would be like looking at your destination in a funhouse mirror. There would be parts of the picture that may look familiar, but others would appear distorted, perhaps even wildly out of proportion.
Significant distortions may be immediately obvious, but more subtle imbalances could present a seductively rosy view of your visitor economy. Either way, making strategic decisions on these twisted representations is a tricky — if not downright risky — prospect.
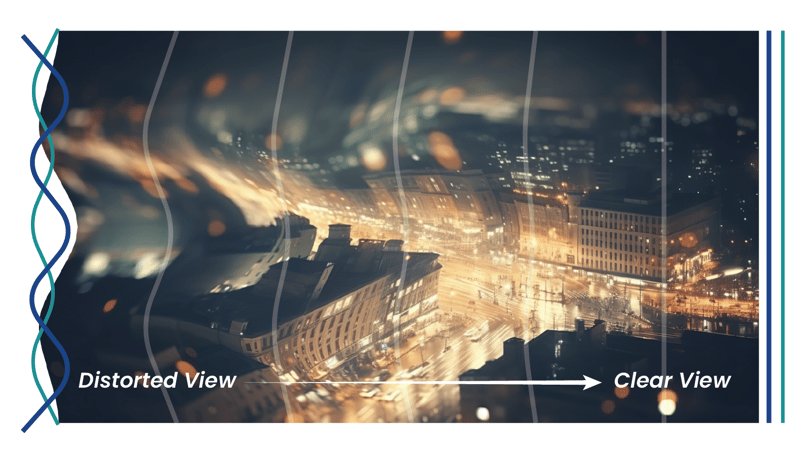
The process of normalization identifies each of the distortions acting on that funhouse mirror, then balances them out mathematically to reconstruct a picture that is much more true to life.
Normalization filters out the noise.
The distortions that occur in geolocation data streams happen across several different dimensions, or biasing factors. Let’s look at one example.
Because geolocation data providers aggregate observations from many different mobile apps, their data streams are susceptible to fluctuations that naturally occur with app usage. Apps go in and out of fashion, or they are added to and removed from the sample pool. These fluctuations cause the number of devices reporting observations to vary significantly over time.
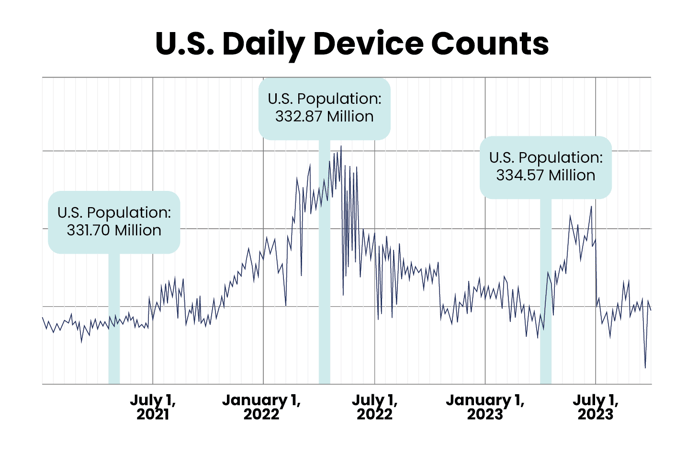
Device counts measure the device supply within a geolocation data set, not an actual change in behavior.
In the chart above, the highlighted sections represent device counts during the month of April in 2021, 2022, and 2023. Although the total U.S. population changed less than 1% from one April to the next, device counts varied as much as 300% in that same time period.
This chart illustrates how device counts within a geolocation data set actually reflect the change in the device supply — not a change in the behavior of people represented by the data set.
Without normalization, the noise these kinds of fluctuations create can drown out the valuable signal of actual visitation behavior — making it impossible to confidently use the data for your destination’s strategic needs.
Our normalization is crafted for destinations.
Part of big data’s value lies in its versatility. Much like how crude oil can be refined into everything from diesel to rocket fuel, big data sets can be applied to a variety of uses — depending on how they are processed.
The normalization methodologies that Zartico’s data scientists apply to geolocation data are specific to the strategic questions that destination leaders ask. Who is traveling to and within my destination? Where do they go, and how do these movement trends relate to other data sets like spending and lodging?
Zartico’s normalization methodologies are unique to the strategic needs of places.
There is no one-size-fits-all algorithm for normalization. Providers focused on asking different questions — analyzing vehicle traffic patterns or retail footfall, for example — may process the data differently. So while their insights may be appropriate for their core markets, they aren’t universally applicable.
Normalization and other data enrichments — such as hotspot removal — are only possible because Zartico receives the geolocation data in its raw form. This gives our data science team the best vantage point from which to apply the methodologies that fit our clients’ needs.
And because we work with multiple data sources, we can go a step further to triangulate the normalized data against credit card spending or lodging occupancy to ensure reliability.
Without normalization, you’re working with a distorted picture — one that blurs the potential you have for making an impact. But with the scientific innovations we apply to our data, Zartico clients can confidently use destination insights to report trends, measure impact, and develop plans to move their communities into the future.