Geolocation Data 101: A Guide to Powerful Place-Based Insights
Where are you right now?
If someone asked you that question, you might give a general answer — I’m in Boston, or at the grocery store, or at my desk, or in my car. (But not behind the wheel, we hope!)
If you were to ask your smartphone the same question, however, it would give a much more specific answer. Your precise location on the planet right now can be described with latitude and longitude coordinates, and your mobile device calculates those coordinates to multiple decimal places.
This type of geolocation data is incredibly useful for analyzing the ways that people interact in time and space. This data is used to provide turn-by-turn directions in a map app, to show you the weather forecast for your area, to track your training runs for that upcoming half marathon, or to find the nearest pizza joint — just to name a few examples.
Our Zartico Destination Operating System™ uses geolocation data to help our clients understand how residents and visitors experience their destinations. Because travel is fundamentally place-based, the ZDOS™ layers geolocation data with identified places of impact, or POIs, that together provide a clear view of where and why visitors visit.
To fully understand how all of this works, it’s helpful to know a few important things about geolocation data. Here are some of the questions we frequently hear from destination leaders:
- Where does geolocation data come from?
- Do mobile apps follow and record my every move?
- What can I learn from analyzing geolocation data?
- What is data normalization? Why is it important?
- How can I understand changes in sample size?
Where does geolocation data come from?
We’ve established that geolocation data consists of latitude and longitude coordinates, usually tied to a specific time and date. But why do our smartphones collect this data, and where does it go?
The short answer is that your mobile phone collects this data because you give it permission to do so through the various apps that you use — including the map, weather, fitness, and restaurant apps mentioned in the example above.
Depending on your privacy settings and the app’s terms of service, once your geolocation data is collected, it is scrubbed of any personally identifying information and then sold as a way for app companies to monetize their work and offer more free apps.
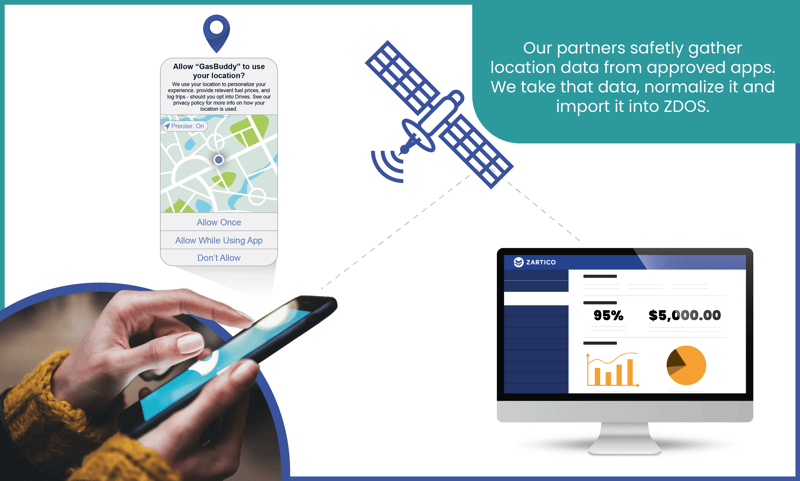
Zartico partners with Near to ingest the largest commercially available stream of geolocation data, which is vital to our ability to clean and filter the often-messy data while maintaining large sample sizes and small margins of error. (Learn more about that below.)
Do mobile apps follow and record my every move?
No. Contrary to popular belief, geolocation data does NOT follow anyone around reporting their location 24/7. Only some apps collect geolocation data, and those apps do so at different frequencies.
You might imagine two different Saturdays — one when you stay home and spend time with your family, and other where you take a roadtrip to explore a new town. On the first Saturday, you may have no reason to open any apps that record your location, while on the second Saturday, you may interact with multiple location-based apps several times throughout the day.
Another helpful analogy is to think of geolocation data as a single-question survey asking, “Where are you right now?” Zartico Co-founder and Chief Innovation Officer Jay Kinghorn explains:
What can I learn from analyzing geolocation data?
By leveraging the highest-frequency and highest-resolution geolocation data available, users of the ZDOS™ can access a feed of all the location data collected within the destination, organized by POI and visitor type.
This allows destinations to see what’s actually happening in near real-time — a big improvement over traditional survey studies that are only able to show what happened (or even only what respondents recall). And this data is always available — no more waiting several months between reports.
Geolocation data can answer strategic questions such as:
- Where are my visitors coming from?
- Which areas of the destination do people visit most?
- Where are there opportunities to disperse visitors throughout the destination?
- How does visitation vary by season or by day of the week?
- Are our state parks used more by residents or by visitors?
- How do visitation patterns compare to last year?
- Where do convention travelers visit outside of the convention center?
- What portion of visitors are staying in hotels?
The answers to these questions help destinations in countless ways, from informing marketing strategy to aligning with stakeholders on important community topics.
It’s also important to note that geolocation data is not the right answer for every question. For example, today’s technology does not allow for geolocation data to answer the question: How many people hiked on our most popular trail this weekend?
No data set records 100% of devices, and not every device is observed every day. Therefore geolocation data does not reflect all visitors to any location — whether it’s a city convention center or a whole state or county.
The value of geolocation data lies in its directional insights — the ability to understand patterns and changes over time.
What is data normalization? Why is it important?
Every geolocation data set on the planet experiences fluctuations in the distribution and volume of observations over time.
There are many possible reasons for these natural variations:
- Changes in personal app usage (remember the Tale of Two Saturdays above)
- Personal choices to opt in or out of data sharing
- New phones being purchased, or old phones being retired
- New location-sharing apps entering the marketplace, or old ones going out of fashion
Normalization is the process of using statistical and data science techniques to remove this variability. You can think of it like a shock absorber, or like a stabilizer that allows you to capture great videos by smoothing out the motion of the camera.
At Zartico, our dedicated data science team performs a two-pass normalization process that “anchors” the geolocation data against a known data source. We also validate the normalized data against trusted data sources so that you can be confident in reporting and making decisions with your findings.
The end result is data that is more consistent, reliable, and accurately representative of visitation trends.
It’s important to note that this extensive normalization process is only possible because Zartico receives the geolocation data in its raw form. It’s much more difficult to accurately normalize aggregated data, so be sure to ask about this if you’re evaluating multiple data providers.
How can I understand changes in sample size?
For users who are new to interpreting and analyzing geolocation data, the natural daily fluctuation in sample size or device count often raises some questions, namely, “How can I be confident in data that changes every day?”
There are a few things to unpack here.
1. Changes in sample size are natural — and they’re present in other forms of data, too
It’s helpful to understand why device counts change from day to day. Some of these factors include changes in consumer behavior or device usage as mentioned above, and counts are affected by outside factors such as the strength of cellular signal. And of course, actual changes in visitation will change the device count, too.
What is more important is not how the sample size changes but how we interpret and communicate the findings.
If we return to the analogy of geolocation data as a single-question survey, then we can see that variability is a natural part of the data collection method. If, for example, you stood on a street corner with a clipboard and surveyed every person who walked by every day for a week, you would certainly expect to encounter different numbers of people each day due to factors such as weather, nearby events, or personal habits.
In this example, you wouldn’t report that you surveyed 128 people on Monday, 286 people on Tuesday, and so on. No, you would say that 36% of the people surveyed prefer cats to dogs. Here, as in geolocation data, focusing too much attention on the changing sample size simply distracts from available data insights.
Watch Jay explain this phenomenon in more detail:
2. Geolocation provides more than enough data
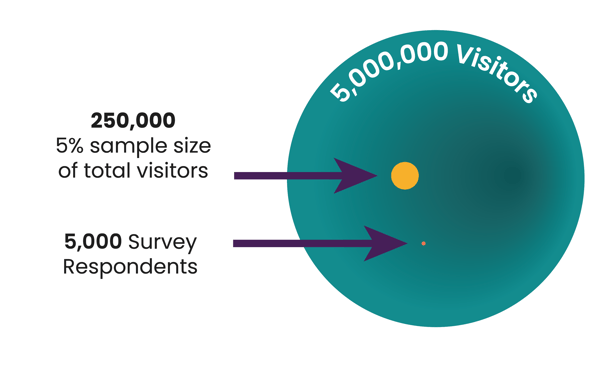
The geolocation data that Zartico receives from Near represents approximately 5% of all mobile devices. While at first glance, this may seem like a narrow slice of the visitor economy, it’s actually a much larger sample size than many that we encounter every day.
For example, new pharmaceutical drugs — in carefully designed, highly regulated clinical trials — are tested on 0.001% of the U.S. population. Crash test ratings for cars are developed based on testing approximately 0.0001% of all cars on the road.
In other words, modern geolocation data sets represent a sample approximately 5,000 times larger than the ones we routinely trust for our own health and safety. Within the destination management industry, geolocation data offers insights based on sample sizes many times larger than even the most thorough survey studies.
This large source of data not only adds confidence that observed trends reflect actual trends in the population — read our whitepaper on sample size and representitivity for more on the Law of Large Numbers — it also means our data science team has more than enough data to clean, filter, and normalize while maintaining appropriate margins of error and confidence intervals.
3. Sometimes you need to zoom out
Remember, geolocation is a tool best used for understanding directional trends in visitation and movement. With that in mind, there’s one important best practice that will help you capture meaningful insights and share them with confidence: Zoom out.
The more granular you get with your analysis — such as looking at data for a single POI or a single day — the smaller your device count will be. Drill down too far, and your sample size may not be large enough to learn from. Here’s what you can do instead:
- Look at a region or a grouping of POIs instead of just one. If you want to know how people moved around a summer festival, don’t limit your analysis only to the city park where it was hosted — look at the whole neighborhood or downtown area where festival-goers are likely to have spent time.
- Expand your date range. Trends are best observed over time, so consider three, six, or even 12 months in your analysis. Insights also derive their meaning from context, so comparing your findings to the previous year or season can illuminate trends you might not see otherwise.
- If you’re using the ZDOS™, keep an eye on the sample size calculator at the bottom of every page. We’ve color-coded this handy tool to help you understand when you may need to zoom back out.
Jay shares a few more guidelines for finding confidence in geolocation data:
Wrap it up: Geolocation data is a powerful tool
This place-based information offers deeper insights than destinations have ever had access to before.
Destination leaders can observe trends in actual movement and behavior in near real-time and make data-led decisions that create real impact on their communities. And because these data sets include both visitors and residents, there are far-reaching possibilities for community stakeholders, municipal planning, and beyond.
To maximize the value of geolocation data, it’s important to ask the right questions. Zoom out and get curious about the big picture — what you learn may just surprise you.
Watch our full video series on understanding the potential of geolocation data on the Zartico YouTube channel.